Authored by: CA Punit Khandelwal & CA Sunit Khandelwal
Assisted by: CA Gargi Gupta
Foreword
We are pleased to come out with our holding company discount (“HoldCo Discount”) study based on the analysis of select listed holding companies across major sectors in India during the past 5 years.
The study could be of importance to the valuation professionals when dealing with the question on the quantum of discount to be applied for valuing the holding of a minority shareholder in an entity that is essentially an investment vehicle. The empirical evidence is based on market data which can be considered to be a reliable basis when addressing the holding in a private enterprise which is a conglomerate.
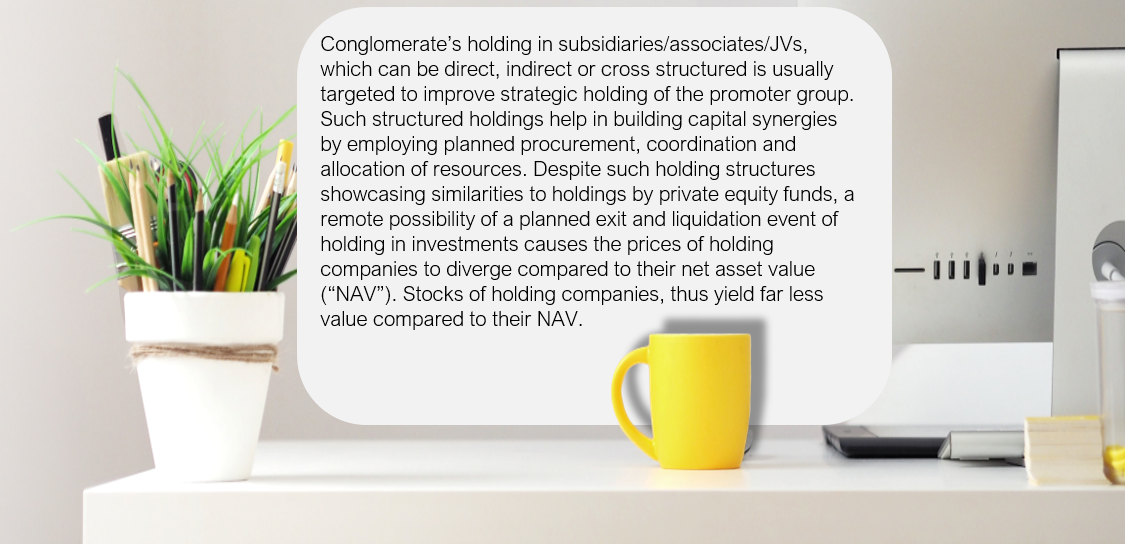
A holding company or conglomerate discount occurs when a holding company’s market capitalisation is less than the sum of the investments and other net assets that it holds. The level of discount is the difference between the aggregate value of each investment in the conglomerate and its market capitalisation.
The results indicate that the discounts, influenced by several factors – industry sector, timing within the economic cycle, multi-layer subsidiaries, reporting complexity and market capitalization, vary across time and sectors.
We hope you find the results of our study of interest and value.
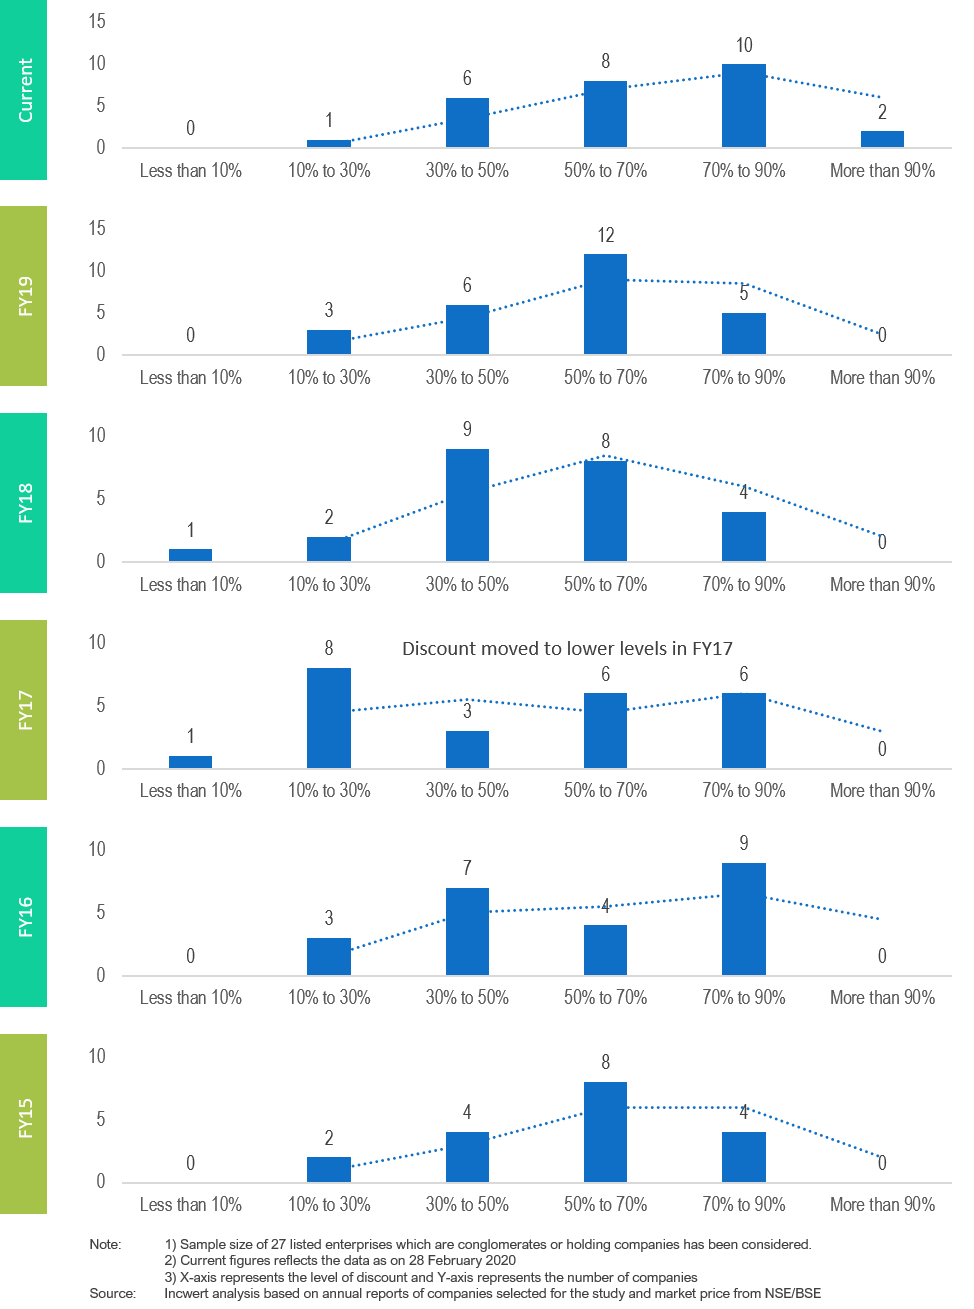
Median of Holdco discount during the last 5 years has been in the range of 45 per cent to 70 per cent
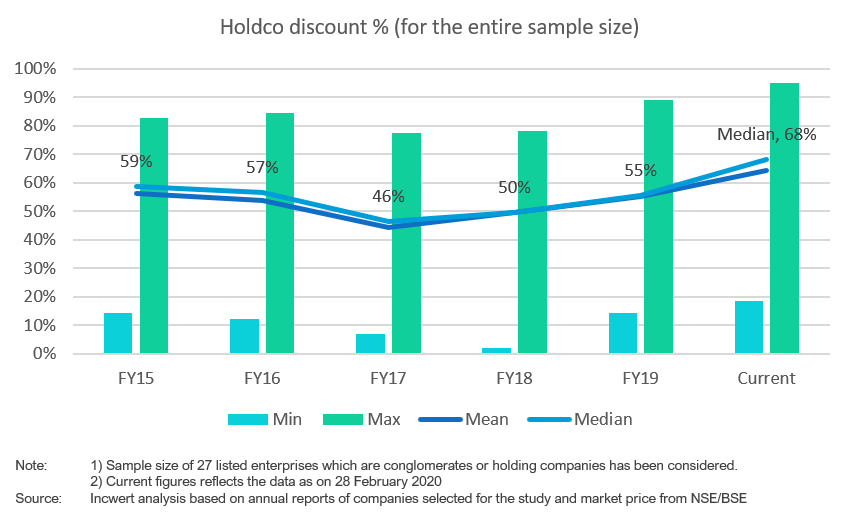
The range of discount is driven by:
- Industry, sector and timing within the economic cycle
- Quality of investments held by the Holding Co
- Level of earnings from dividend and interest, and subsequent distribution to shareholders of Holdco
- The complexity of reporting structure. Minority shareholders tend to discount companies that have complex structures as information on businesses may not be available/ accessible on time
- Multi-layer of subsidiaries results in the parking of assets/liabilities in SPVs. Marginal investors at times, do not have relevant information to value such subsidiaries/ investments.
- Cross holding in other private companies which potentially results in lack of comprehensibility
- Cascading effect of dividend distribution tax in a multi-tier structure.
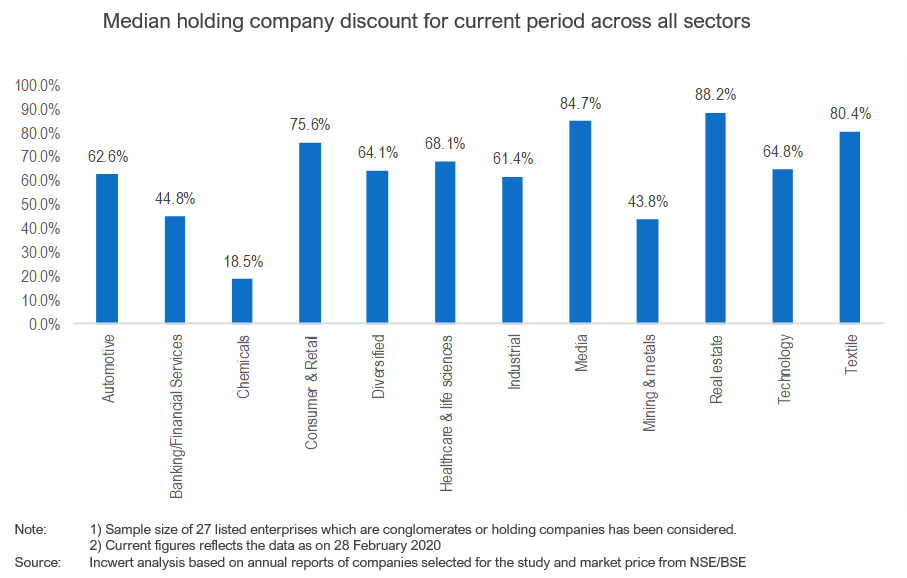
Current median Holdco discount across the select set of companies is c.68 per cent

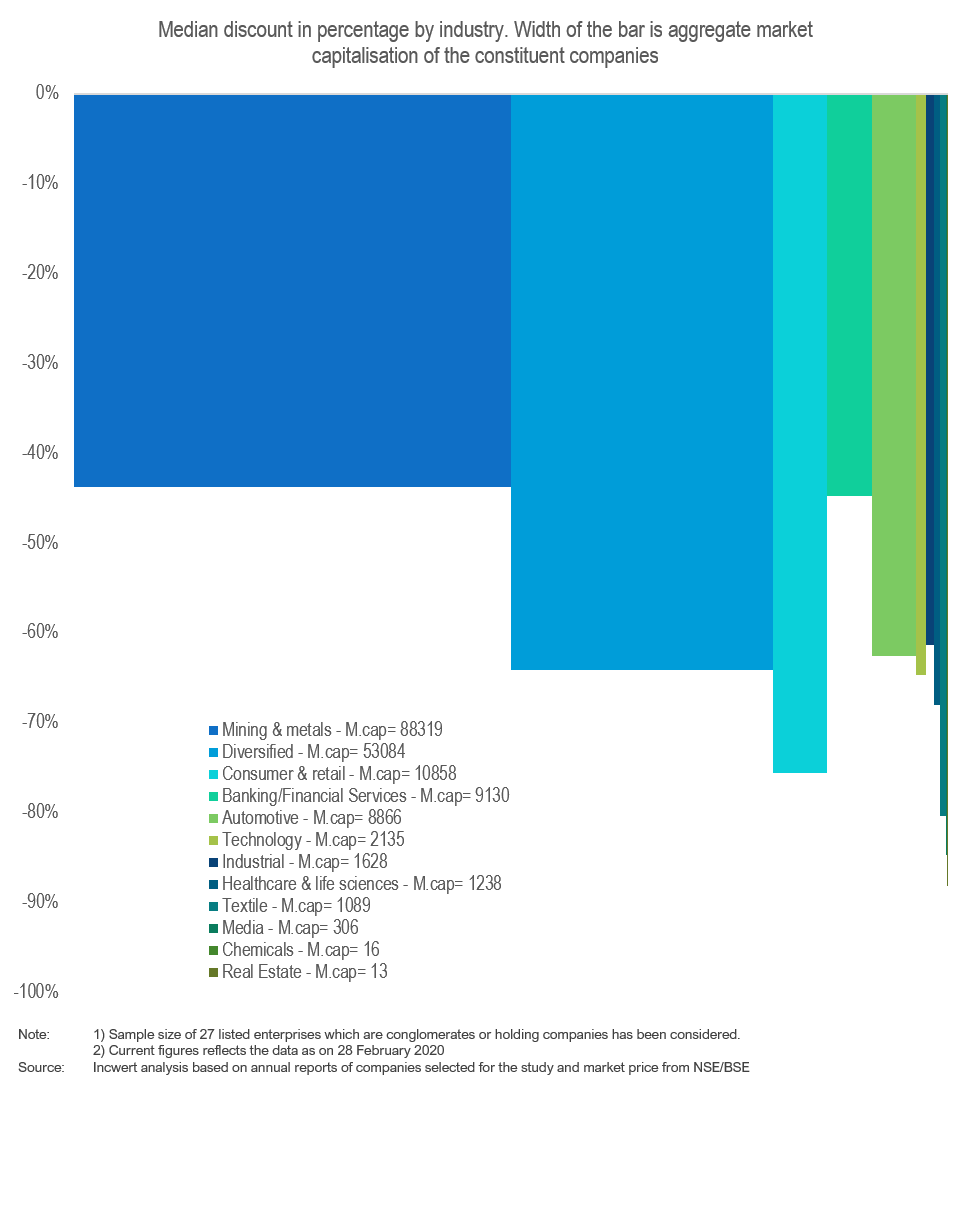
Mining & Metals followed by Diversified sector have the highest weight in the distribution of Holdco discount
Variability in skewness and kurtosis observed in the distribution of companies for Holdco discount
Our methodology
- We have analysed listed holding companies (“Holdcos”) in India across all major sectors having listed investments and are trading at discount in the market over the 5-year period ending February 2020.
- The implied holding company discount is calculated by comparing the market value of the listed holding company with its total value of holdings.
- Holding company discount (INR) = Total value of holdings- Market value of holding company
- Holding company discount (%) = (Total value of holdings- Market value of holding company) / Total value of holdings
- Net Asset Value (NAV) method has been used for ascertaining the total value of holdings.
- Net Asset Value = Total value of assets - Total value of liabilities
- Total value of assets include long term and short-term investments in subsidiaries, associates, joint venture and equity shares (quoted and unquoted); gross block; other current assets
- Total value of liabilities includes all current and non-current liabilities.
- Listed investments in subsidiaries, associates and joint ventures are taken at market value and rest investments on book value. Investments in subsidiaries, associates and joint ventures are calculated just by multiplying % holding with its market value.
- All other assets and liabilities are considered at book value.
Understanding the Holdco study…
What is Holding company
A conglomerate or a holding company typically exhibits the following characteristics:
- does not have any material business operations of its own;
- exists mostly to own assets via holding controlling stock or membership interests in other companies;
- primary revenue is dividend income and interest earnings;
- operating income tends to be consistently less than the value of the assets that it holds.
Why Holding company discount arises
- Holding companies are more complex to analyze and determine the true value versus the value of its operating assets
- Holding companies tend to be a sum of disjointed businesses which an investor is forced to buy even though he/she does not like a specific investment of a holdco company
- Holding companies are mostly promoter-driven companies and hence the actions may not suit the return and risk objectives of minority shareholders
- Holding companies usually are valued based on the liquidation value of the investments. However, such liquidation value may not be realised as the holding company will rarely sell their investments in group companies due to strategic/synergistic benefits.
- Internal policies could prevent the holding company from realising the value of shares which may also get factored into the discounted pricing.
Limitations
- The value of holdings other than quoted investments in subsidiaries/associates is taken at book value.
- For the current period (till February 2020) the value of holdings other than quoted investments in subsidiaries/associates is taken same as of 31 March 2019.
- Current period % holding is taken the same as on 31 March 2019.
- Value roll-up has been performed for the first level of holdings. Investments of step-down subsidiaries/associates have not been considered.
- Market prices as at the period end have been considered.
Disclaimer:
This publication has been carefully prepared only for education purpose and is not a research report or any kind of investment advice. Neither authors of this publication nor Incwert Advisory Private Limited have any kind of conflict of interest with any company/firm/entity which has been cited and have been used for the sole purpose of illustration. It has been written in general terms and is not intended to address the circumstances of any particular individual or entity. Although we endeavour to provide accurate and timely information, there can be no guarantee that such information is accurate as of the date it is received or that it will continue to be accurate in the future. It should be seen as broad guidance only and does not constitute professional advice. You should not act upon the information contained in this publication without obtaining specific professional advice after a thorough examination of the particular situation. No representation or warranty (express or implied) is given as to the accuracy or completeness of the information contained in this proposal, and, to the extent permitted by law, Incwert Advisory Private Limited (“Incwert”), its members, employees and agents accept no liability, and disclaim all responsibility, for the consequences of you or anyone else acting, or refraining to act, in reliance on the information contained in this publication or for any decision based on it. Without prior permission of Incwert, this publication may not be quoted in whole or in part or otherwise referred to in any documents.

