Authored by: CA Punit Khandelwal & CA Sunit Khandelwal
Assisted by: Sarthak Garg
Foreword
Assessment of systematic risk of a company in the form of Beta, an essential determiner in the capital asset pricing model, tends to be generated by valuers based on current conditions prevailing during last 1-3 years and occasionally up to five years without accounting for conditioning information.
In this paper, we have presented a study of Cyclical Beta to account for conditioning information, given that the relationship between stock returns and economic variables is not constant over time. The study analyses the Beta for various sectors in India in the past 20 years in conjunction with the business cycle – expansionary or contractionary - at that point-in-time.
Through this Cyclical Beta Study, we note that Beta for stocks (primarily cyclical stocks) have shown higher Beta in expansionary cycles and lower Beta in contractionary periods. Consequently, this study draws three main observations, conclusions and suggestions:
1.Ready reckoner for sectoral Beta across sectors and business cycles between 1999-2019
2.Discovery of median values for the expansionary cycle and contractionary cycle Betas in specific sectors
Beta adjusted for sectoral ‘mean reversion’: 2/3rd x observed Beta + 1/3rd x median cyclical sectoral Beta*
Median cyclical sectoral Beta may be used based on the long-run Beta values for the sector. Adjustment could be based on valuer’s judgement of whether the economy is in the expansionary or contractionary cycle, determined after analysing the macroeconomic indicators and state of the economy.
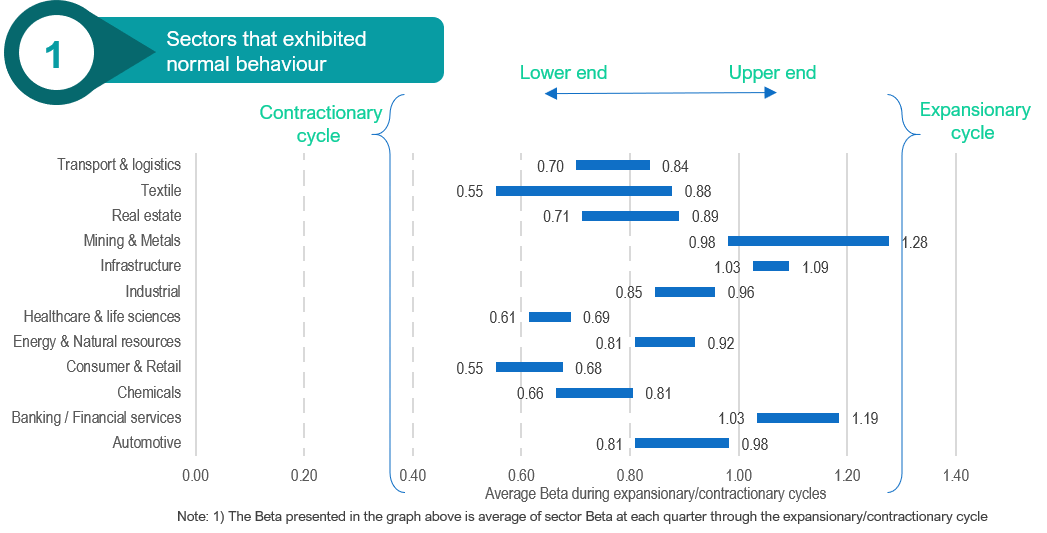
Beta exhibited during the contractionary cycle is lower compared to the expansionary cycle for most of the sectors

Key observations
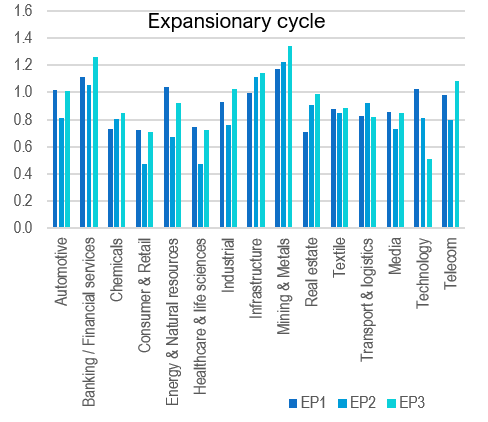
- Consumer & Retail and Healthcare & Lifesciences which are defensive sectors compared to others, exhibited Beta during the expansionary and contractionary cycle of approx. 0.7 and 0.6, respectively.
- Infrastructure with an overall average Beta of 1.06 appears to be highly correlated to the equities, albeit dispersion by cycles within the extended time series of 20 years exhibits a directional step-up in the level of volatility from period 1 to 3, a reflection of the financial stress the sector underwent during the last decade.
- Highest positive swing (% higher expansionary cycle Beta vs contractionary cycle Beta) has been observed in textiles sector (59%).
- Mining & Metal and Banking/Financial Services sector Beta have the highest volatility with contractionary cycle Beta closer to 1.0 and expansionary cycle Beta around 1.2 to 1.3. As such, these sectors tend to move higher than the market.
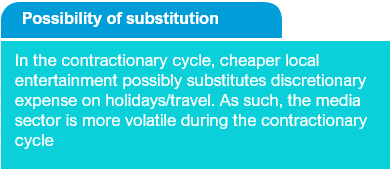
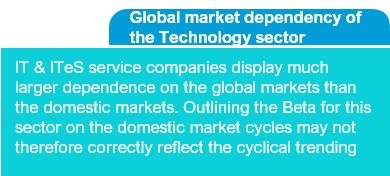
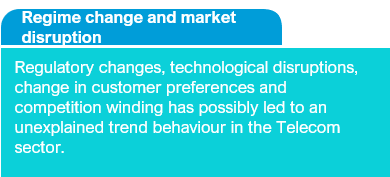
- Media, Technology and Telecom sectors have exhibited converse behaviour where median Betas during the contractionary cycle in India were observed to be higher than the median Betas during the expansionary cycle.
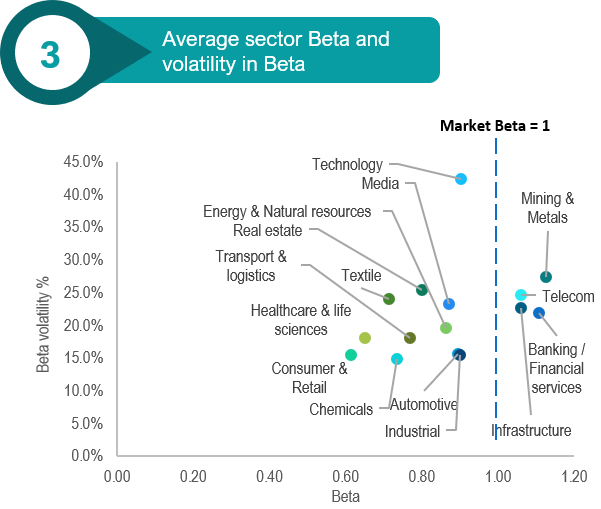
- Banking/financial services, Telecom, Infrastructure and Mining & Metal sectors exhibit average Beta of more than 1.0
- The volatility of Beta in the Technology sector appears to be an outlier compared to other sectors.
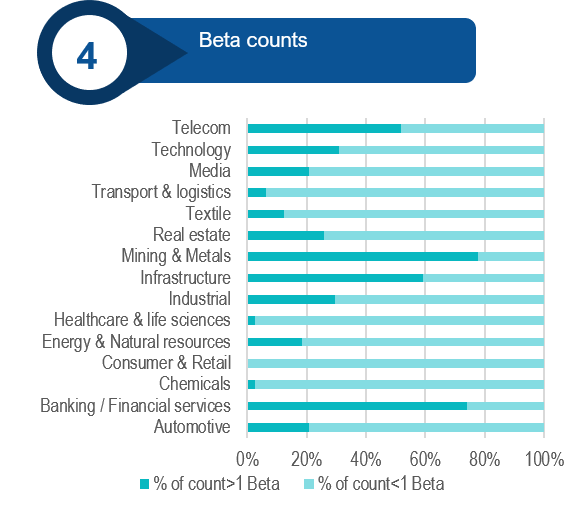
- Consumer & Retail sector is the only sector to have a Beta of less than 1.0 in all the observable quarters (81 in number).
- Healthcare & life sciences and Chemicals are the other two sectors that exhibit Beta of less than 1.0 in 95% counts.
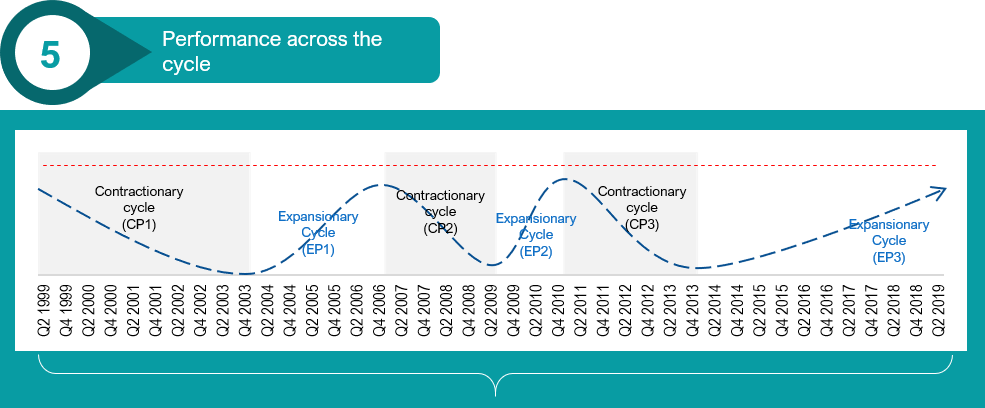
Key observations
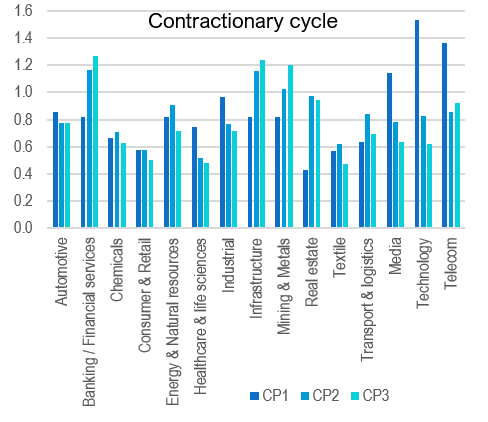
- Sector Betas in Contraction period 2&3 exhibit certain level of directional bonding and proximity when compared to Contraction period 1
- Sector Betas in the Expansionary period 1&3 exhibit similarities in the range of systematic risk
Methodology considered

Limitations of the study
- Selection of companies is limited to top 10 under each category. For companies of smaller size, volatility of return could be higher and risk exhibited in their Beta could embed some component of diversifiable risk towards their size.
- Roll-over test of companies has been carried out at each year-end only.
- Beta considered is computed based on 1-year daily returns and is hence, likely to reflect the systematic risk as prevailing at that point in time only.
This publication has been carefully prepared only for education purpose and is not a research report or any kind of investment advice. Neither authors of this publication nor Incwert Advisory Private Limited have any kind of conflict of interest with any company / firm / entity which have been cited and have been used for the sole purpose of illustration. It has been written in general terms and is not intended to address the circumstances of any particular individual or entity. Although we endeavor to provide accurate and timely information, there can be no guarantee that such information is accurate as of the date it is received or that it will continue to be accurate in the future. It should be seen as broad guidance only and does not constitute professional advice. You should not act upon the information contained in this publication without obtaining specific professional advice after a thorough examination of the particular situation. No representation or warranty (express or implied) is given as to the accuracy or completeness of the information contained in this proposal, and, to the extent permitted by law, Incwert Advisory Private Limited (“Incwert”), its members, employees and agents accept no liability, and disclaim all responsibility, for the consequences of you or anyone else acting, or refraining to act, in reliance on the information contained in this publication or for any decision based on it. Without prior permission of Incwert, this publication may not be quoted in whole or in part or otherwise referred to in any documents.


