Authored by: CA Punit Khandelwal & CA Sunit Khandelwal
Assisted by: CA Allen Vincent
Foreword
Equity Markets internationally and in India have rebounded to all-time high prices, bringing to fore the question on assessing the quantum of volatility in the asset prices differentiated by size. Our study on determining the volatility in equity returns is also guided by the need for valuing the options of unlisted entities wherein the size and sector of guideline companies play a critical role.
In determining the volatilities, we have given due consideration to observable time frame and selection of indices. Several smaller, less diversified enterprises, companies operating in riskier areas such as biotechnology tend to have higher volatilities. For understanding the volatility of such enterprises, we have considered companies having market capitalisation ranging between INR 100-200 crores (or INR 1,000-2,000 million) as a benchmark.
This study could be of worth to the valuation professionals when undertaking the valuation of equity-based compensation and share-based payments made by privately held companies and start-ups, for financial reporting purposes. We hope you find the results of our study of interest and value.

Key findings of the study
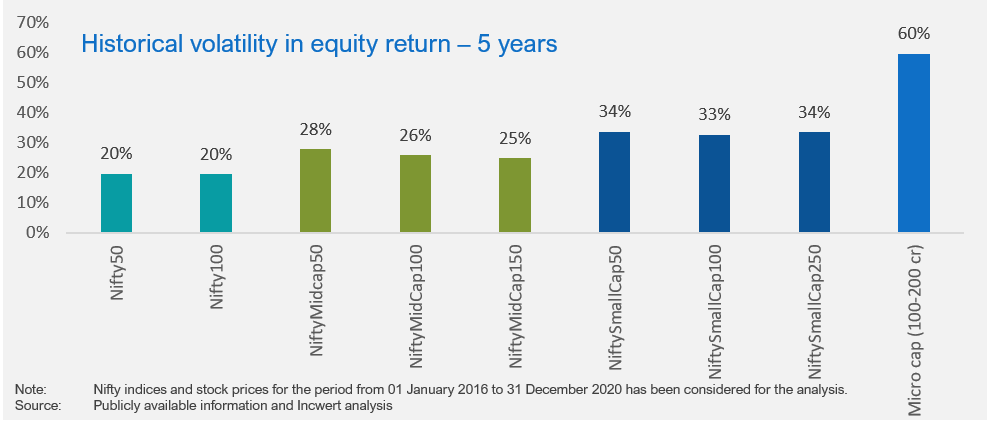
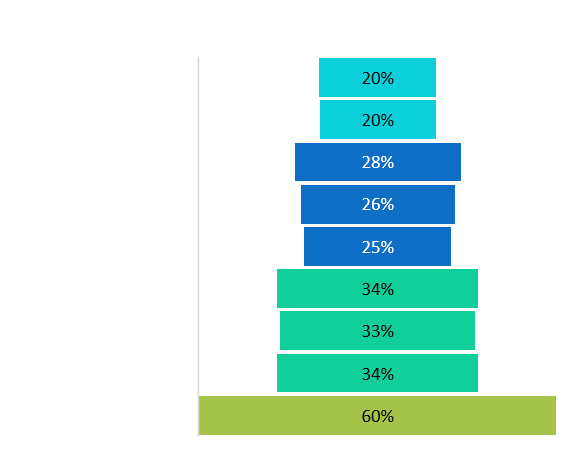
Large-cap companies have the least volatility of ~ 20%
Mid-cap companies display moderate volatility ranging between 25-30%
Small-cap companies have volatility in the band of 30-40%
Micro-cap companies have the highest volatility averaging 60-65%
Based on our analysis, we observe that the volatility in the equity return band is increasing as the market capitalisation of the companies is decreasing. The finding is not surprising given that small-cap companies tend to be riskier investments than large-cap companies. They have greater growth potential and tend to offer better returns. Still, they do not have large-cap companies' resources, making them more vulnerable to adverse events and bearish sentiments.
The micro-cap companies (chosen as enterprises with a market capitalisation in the range of INR 100-200 crores) tend to be a good proxy for assessing the start-ups' risks. Non-trading days are typically high in micro-cap companies, making them a suitable alternative for testing the risk arising from lack of marketability of unlisted start-up enterprises.
Micro-cap companies (with a market capitalisation of INR 100-200 crores) had a volatility of 60-65% in equity returns
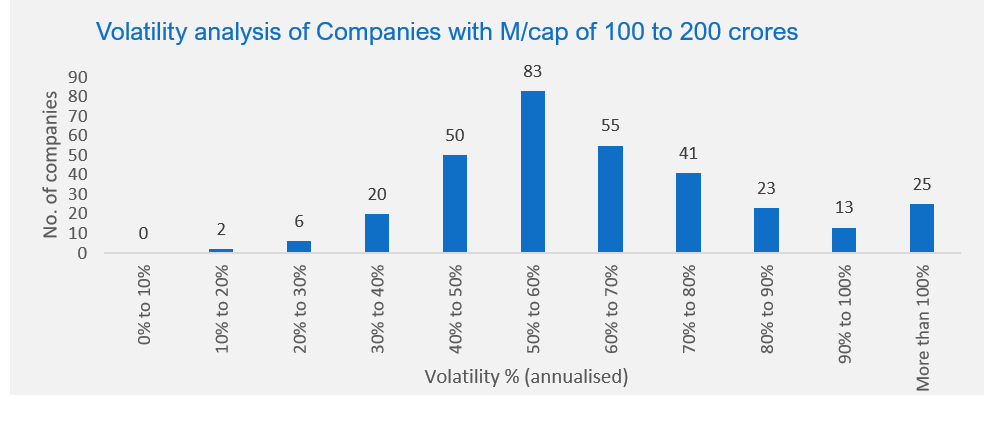
Analysis of monthly returns of 318 micro-cap companies suggests the following:
- Mere 9% (company count: 28) of the selected sample displayed annualised volatility of less than 40%
- 83% (company count: 265) of the sample size displayed annualised volatility of more than 40% but less than 100%
- 8% (company count: 25) of the sample had annualised volatility of more than 100%
- The average annualised volatility was 65%
The median annualised volatility was 60%
The empirical study is in line with volatilities observed in the security-based approaches used for measuring discount for lack of marketability in the US.
For example, Chaffee determined his proxy of a Discount for Lack of Marketability based on volatilities in excess of 60% based on analysis of small Over the Counter (“OTC”) public companies.
A brief overview of our approach
- In performing the analysis, we analysed Nifty indices across different market capitalisations (i.e. large-cap, mid-cap and small-cap). For setting up the reference micro-cap sub-set, companies listed in India (in either NSE or BSE) with a market capitalisation of INR 100-200 crores were analysed.
- For the micro-cap, a total of 318 companies with a share price history of over two months at 31 December 2020 were selected. The selected set has a certain level of survivorship biases as 60 companies in the chosen sample have a trading history of fewer than five years.
- Monthly returns were computed for the past five years ending 31 December 2020.
- Volatility was computed based on monthly returns of the Nifty indices and share prices of the micro companies over the said period. The monthly volatilities were annualised using a factor of sqrt of twelve (√12).
Volatility – Meaning and its role
Meaning
In finance, volatility is a measure of the dispersion of returns for a given security or market index. In other words, it gauges how much the value of securities or market indices can fluctuate.
Volatility is measured using either standard deviation or variance. In both the cases, higher the value – more volatile are the prices of the securities and market indices, hence it makes them riskier for the market participants. Companies with low volatility, such as regulated industries and other large-cap companies, are expected to grow slowly, but steadily, over time. On the other hand, the stock prices of higher volatility companies (e.g., start-ups) can move significantly from one day to the next.
Generally, there are three measures to estimate volatility. The first, historical volatility, refers to the actual variability in the movement of own stock over a specified historical period. The second measure, implied volatility, is the volatility generated from the actual trading price of market-traded options; it is the market’s “consensus” estimate on a company’s expected future volatility. A third measure, used primarily by private or newly listed companies, involves deriving volatility by benchmarking with the historical (or implied) volatilities of peer companies.
Role in Valuation
Volatility has a remarkable role as a factor determining the valuations:
- valuation of stock options,
- assessment of discount for lack of marketability using security-based or analytical approaches,
- analysis of restricted stock,
- examination of other forms of equity-based compensation and share-based payments
Understanding, selecting, and using an appropriate volatility factor is important to accurately determine the value of financial instruments issued by entities.
Disclaimer: This publication has been carefully prepared only for general information and education purpose and is not a research report or any kind of investment advice. Neither authors of this publication nor Incwert Advisory Private Limited have any kind of conflict of interest with any company/firm/entity which has been cited and have been used for the sole purpose of illustration. It has been written in general terms and is not intended to address the circumstances of any particular individual or entity. Although we endeavour to provide accurate and timely information, there can be no guarantee that such information is accurate as of the date it is received or that it will continue to be accurate in the future. It should be seen as broad guidance only and does not constitute professional advice. You should not act upon the information contained in this publication without obtaining specific professional advice after a thorough examination of the particular situation. No representation or warranty (express or implied) is given as to the accuracy or completeness of the information contained in this proposal, and, to the extent permitted by law, Incwert Advisory Private Limited (“Incwert”), its members, employees and agents accept no liability, and disclaim all responsibility, for the consequences of you or anyone else acting, or refraining to act, in reliance on the information contained in this publication or for any decision based on it.

