Authored by: CA Punit Khandelwal & CA Sunit Khandelwal
Foreword
We are pleased to issue the second edition of Equity Risk Premium in India study, which analyses the risk premium to be considered when determining the cost of equity using the capital asset pricing model.
The study focusses on quantitative analysis to derive the current equity risk premium under different approaches including a) historical premium, b) survey approach, c) country bond default spread approach, d) country bond default spread approach adjusted for relative country risk, e) domestic market volatility relative to a developed market, f) and implied equity risk premium.
COVID-19 crisis has led to a significant increase in the volatility of stock prices and widening of credit spreads. 5Y sovereign CDS too peaked to nearly 239 points during end of March 2020. As a reaction to the economic slowdown, RBI in May 2020 reduced the Repo rates by 40 basis points to 4 per cent and by 115 bps since the lockdown. Amid the on-going stress, India has also witnessed a rating downgrade to “Baa3” from “Baa2” along with a cut in GDP forecast to 1.8% for FY21.
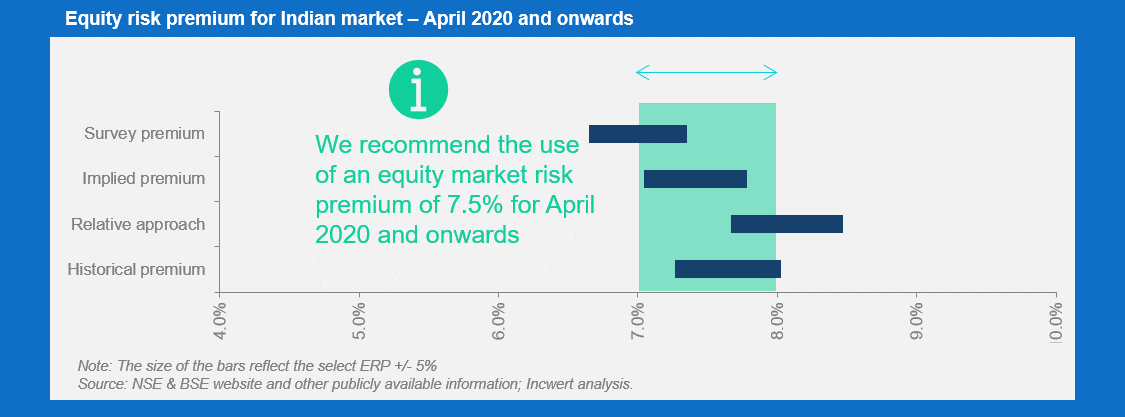
Based on the current market conditions, we recommend India ERP of 7.5% ( 7% and 8% being the lower and upper limit of the range, respectively) beginning April 2020.
The study may be vital for valuation practitioners to be able to assess the risk in the underlying business appropriately. We hope you find the results of our study of interest and value.
Analysis in brief
In the graph below, we present the select outcome of a) Historical premium, i.e. historical returns earned in the past on Sensex stock relative to the risk-free rate, b) Benchmark premium based on US market equity risk premium, c) Implied premium and d) Survey by Pablo Fernandez, Javie.r Aguirreamalloa and Pablo Linares
1. Estimation of ERP– historical premium
Overview
This section presents the equity risk premium in India on a historical basis by analysing the data available in the public domain. Our analysis widely relies on the data as available on the recognised stock exchanges (both NSE and BSE) and Reserve Bank of India (RBI).
The table set below summarises the output under different statistical approaches. Where deemed appropriate, the average of numbers has been used as a practical expedient.
The basis for selection of variable in the risk premium function
ERP is computed as excess return earned from investment in stock over the base return from investment in risk-free security. In the computation of the ERP, due consideration has been given to the following:
–Selection of market index (S&P BSE Sensex, S&P BSE 100, CNX Nifty, CNX 100, etc.)
–Selection of risk-free security (Treasury bond, Treasury bills, etc.)
–Selection of bond/bill maturity period
–Selection of observable period (1-year, 5-years, 10-years, etc.)
–Selection of statistical approach – mean (arithmetic/geometric), average, min-max, etc.
Arithmetic mean
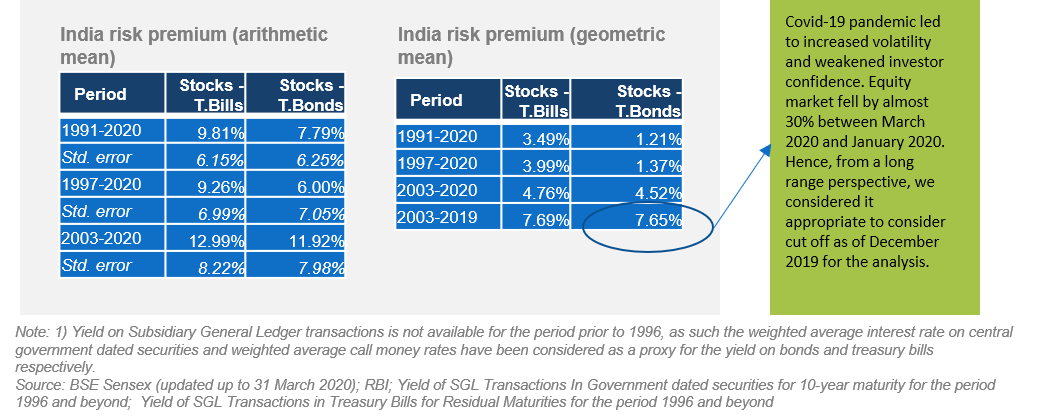
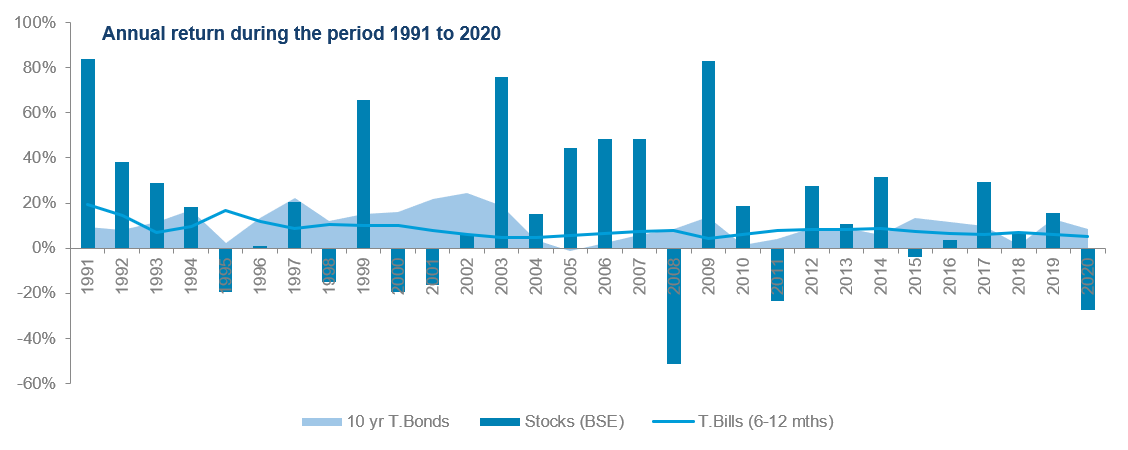
Based on our analysis, we observe that the equity market in India has delivered an average return of 18.2% over the period 1991 to 2020, which is significantly higher when compared to the average return on treasury bond (10.4%) or bill (8.4%) over the same period. High equity return, however, comes with a burden of higher volatility of 33.6% and quite a wide range in distribution of returns.
The equity risk premium, calculated as a difference between the average returns on stock and the average returns on treasury bill for the period 1991 to 2020 is 9.8%. Similarly, the difference between the average returns on stock and average returns on treasury bond over the period 1991 to 2020 is 7.8%.
These estimates are not free from noises. Given the limited coverage period of 30 years, the standard error in these estimates is high - risk premium over Treasury bill and bond forebear high standard error of 6.2% and 6.3% respectively.
Geometric mean
The observed equity risk premium based on geometric mean for the period 1991 to 2020, is 3.5% and 1.2% over the treasury bill and treasury bond respectively. The outcome under geometric mean is skewed downward due to negative correlation over time which is also impacted due to a fall in equity returns as of March 2020 following the COVID-19 pandemic market meltdown.
2a. Implied premium - Gordon’s growth model using dividend as a base
Overview
The implied premium approach makes use of some very basic yet powerful valuation tools to find out the equity premium from the current market conditions, in conjunction with the expected future cash flows. In the table set above, ERP has been evaluated based on Gordon’s Dividend Discount model which is one of the most well-known models in the genre of valuation.

Implied equity risk premium - India
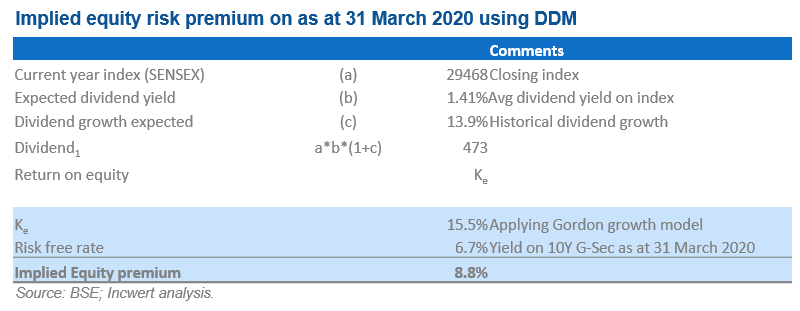
We have used BSE Sensex data to derive the implied equity risk premium. As at 31 March 2020, the BSE Sensex Index closed at 29468 points and the average dividend yield on the index was approximately 1.41%.
The sustainable growth in dividend for companies in the index is assumed to be 13.9% based on the annual compounded growth in the dividend between 1991 and 2020. The yield on the 10-year G-sec bond was 6.7% as of 31 March 2020, the equity risk premium is therefore estimated to be 8.8%.
2b. Implied premium –Gordon’s growth model using FCFE as a base
Overview
This method generalises the DDM methodology to have an allowance for periods of high growth and use cash flows instead of dividend.
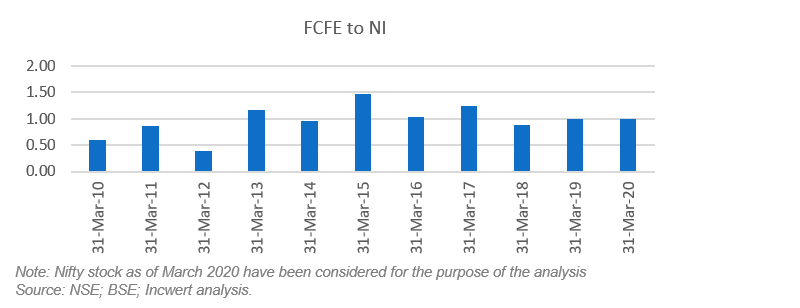
We note that the median of free cash flow to equity (FCFE) to net income (NI) ratio for Nifty 50 stocks during the period 2010 to 2020 is approximately one. Hence, as a practical expedient, we considered earnings as a proxy to the FCFE.
Three-stage growth model has been considered with the following growth built-up assumptions–
- FY2021 – real GDP growth of 1.9% (based on IMF estimate) and inflation of 4.2%
- FY2022 – real GDP growth of 6% (based on IMF estimate) and inflation of 4.2%
- FY2023 to FY2050 – real GDP growth of 4.9% (estimated based on PwC’s ‘The World in 2050’ report) and inflation of 4%
- Beyond FY2050 – the sum of expected inflation and the expected real rate is assumed to be equivalent to the treasury bond rate of 6.7%
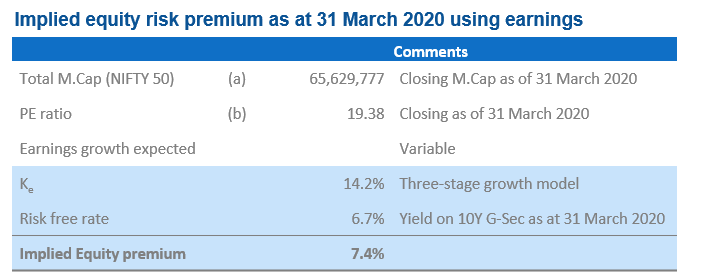

Based on the above assumptions, the implied discount rate, which equates the discounted cash flows of the market cap of Nifty is estimated to be 14.2%. Based on a risk-free rate of 6.7% and index beta of 1, ERP is expected to be approximately 7.4%.
3. Relative approach – country risk premium built-up to the mature market ERP
Overview
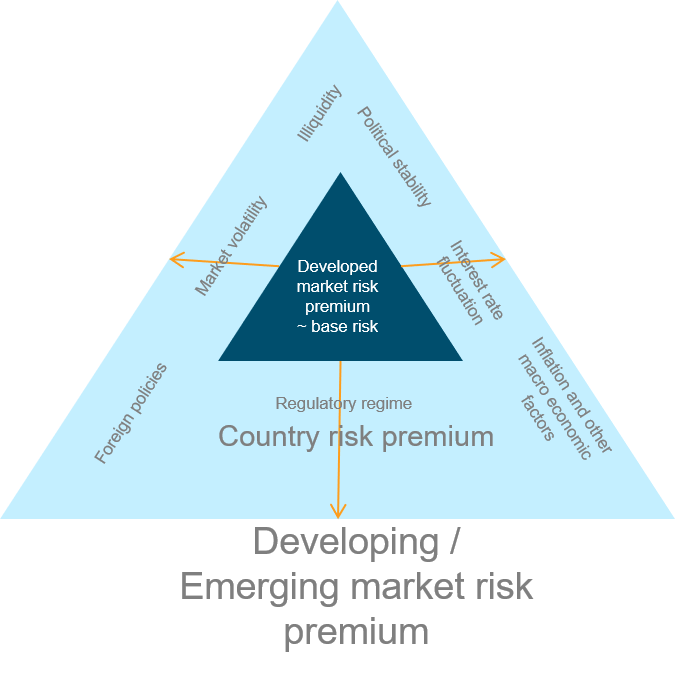
The Relative approach for calculating equity risk premium, albeit not widely used by valuation experts or analysts, computes ERP by adding country-specific risk premium to the base risk premium for a mature market.
This approach is based on the premise that data available for emerging markets is often biased and suffer from potential noise due to market illiquidity and intermittent unexpected market movements. Accordingly, building up additional risk premium over risk in a mature market sets aside any possible anomalies.
In our calculation, we consider the base premium of US equity market to be a good surrogate for mature market risk premium since the US has perhaps the most extended history of the developed equity market. Following variations have been considered while calculation the ERP for India:
–Sovereign bond default spread method: this is a simplistic approach where the credit default spread of India treasury bond over US treasury bond is considered to be an indicator of the country risk premium over the developed market.
–Sovereign bond default spread adjusted for equity market volatility method: this is an advancement of the above method if the sovereign default spread has been adjusted for India equity market volatility and 10-year G-sec price volatility factor.
–Domestic market volatility relative to a developed market: Equity risk of US market is adjusted for the volatility in the US market returns comparable to that of India.
Application of each of these approaches is quite insightful but ridden with their own set of problems. Consider the adjustment factor for equity market volatility to the sovereign default spread – this adjustment assumes that country equity and bond market share a linear relationship, albeit it is not quite so in reality.
3a. Relative approach - Sovereign bond default spread method
Credit default spread approach
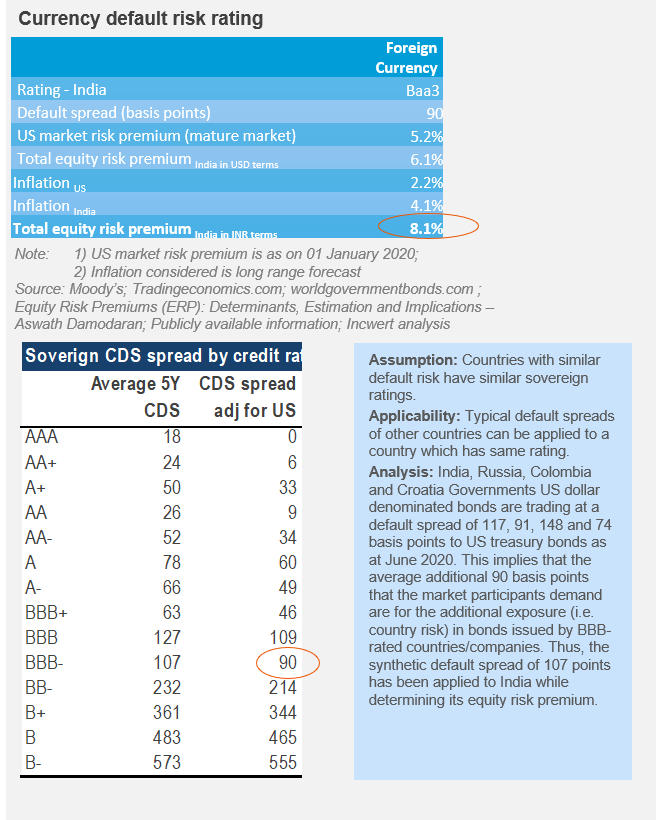
The sovereign credit default spread in case of India has been synthetically derived by comparing it to similarly rated economies and their typical default spreads (i.e. US denominated bond’s yield for countries that bear Baa3 rating minus the risk-free rate of US).
Ratings by Moody’s has been considered for determining sovereign currency rating. Note that Moody’s has rerated India as Baa3 in June 2020 from Baa2 in November 2019.
These ratings reflect the potential risk of default and not the equity risk. Yet, these have been considered as a yardstick of equity risk since they are affected by several of the factors that drive the equity risk. The ‘hard’ macroeconomic factors such as the fiscal deficit, currency stability, interest rates and inflation, and the ‘soft’ issues like the political stability, economic and regulatory environment, etc. affect both credit risk and equity risk.
Equity risk premium - India
ERP for India is derived by adding CDS of 90 basis points to the base ERP of 5.2% of the US market. The resultant equity risk premium for India is 6.1% in US dollar terms. After adjusting for the forward inflation factor, the ERP for India in INR terms is determined to be 8.1%.
3. Relative approach - Sovereign bond default spread (adjusted for equity market volatility) method
Overview
This approach is a step-up on the default spread approach. Since the overall all country equity risk premium is expected to be larger than the country default spread, a certain additional risk is added to the default spread to make it equal to the country risk premium. To compute the estimated spread multiplier, the analysis considers the volatility in equity returns relative to volatility in bond prices. The default spread is multiplied by the relative volatility to derive the adjusted country risk premium
Default spread adjusted for equity risk
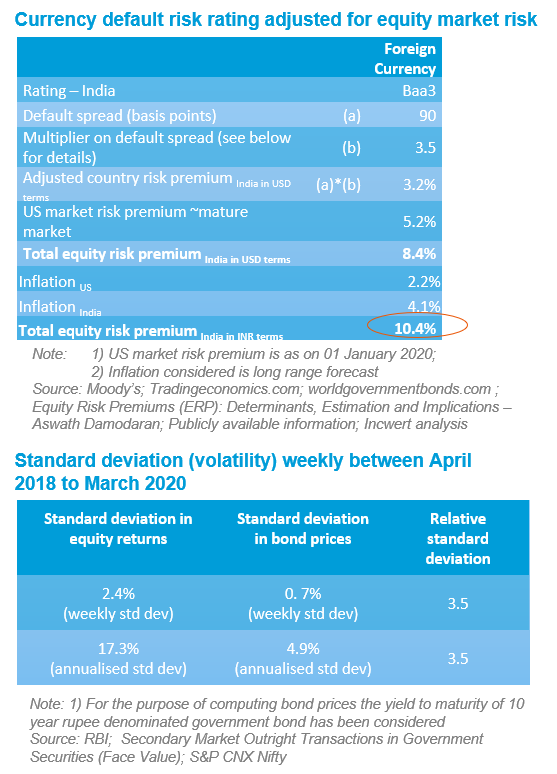
The annualised standard deviation in the Indian equity index (Nifty 50) during the 24 months ending 31 March 2020 was 17.3%, while the annualised standard deviation in the 10-year government bond prices was 4.9%. The resultant additional country equity risk premium for India (in USD terms) is 3.2%.
Adding the country premium of 3.2% to the base ERP of 5.2% of US market results in an ERP of 8.4% for India in USD terms. After adjusting for the forward inflation factor, the ERP for India is derived to be 10.4% in INR terms.
Potential measurement problems
The standard deviation of equity returns is a volatile number across time and given that India is still an emerging market, the volatility could move significantly across different periods.
Further, this approach presupposes a linear relationship between equity market volatility and bond price volatility, whereas the situation is quite different in reality.
3c. Relative approach – Mature market ERP adjusted for relative equity market volatility method
Overview
This approach is based on the premise that imputed risk of different markets can be observed by comparing the volatilities in equity return for each of those markets. Economies with higher risk will usually have a higher standard deviation in equity prices or returns.
Relative equity market volatility in the US and India
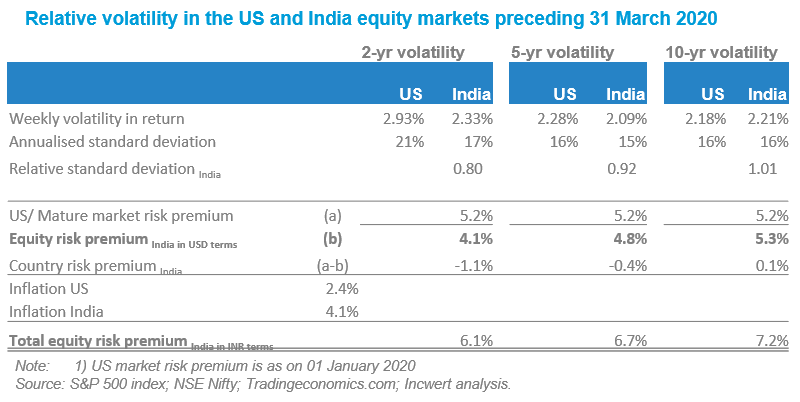
The annualised standard deviation of weekly returns in S&P 500 in two-years, five-years and ten-years preceding 31 March 2020 have been computed in the table below. Correspondingly the annual standard deviation of weekly returns NSE Nifty for the same period has also been computed. The relative standard deviation has been computed for each such period. Daily standard deviations may tend to have much more noise, and hence computations have been done on weekly returns.
Using the relative standard deviation so derived and the US base equity risk premium of 5.2%, the estimated equity risk for India based on two-year, five-year and ten-year volatility is 4.1%, 4.8% and 5.3% respectively. After adjusting for the forward inflation factor, the ERP for India is determined to be 6.1% to 7.2% in INR terms.
Market structure and liquidity differ widely among markets. Under a perfect market scenario, emerging markets would ideally be more volatile than the developed markets; However, illiquidity in emerging markets would more often than not result in lower volatility. This market condition will understate the risk premium for the illiquid market and overstate the risk for the liquid market.
4. Estimation of ERP based on survey
Overview
Globally, several research firms survey finance and economics professors, corporate managers, financial analysts, etc. about their expectation of market returns. Whilst this data is widely available in developed markets such as the US; it is somewhat a challenge to get such data in emerging markets such as India.
In this section, we present the summary of market risk premium in India based on the survey carried out by Pablo Fernandez, Javier Aguirreamalloa and Pablo Linares ('Survey of market risk premium and risk-free rate') for various countries over the various period.

Survey results' reliability in general
Despite there being several of studies or surveys being carried out by research firms and given the fact that a level-headed range for equity premium does emerge from these surveys; still, the acceptance level of such an approach by finance practitioners is low. Though there is nothing incorrect with the approach that is usually adopted to carry out such survey, rather it is the individual's reasoning that could be potentially inhibited while interpreting the market dynamics. To estimate the risk, most respondents rely on the recent market environment. Their assessment may thus tend to be weighted towards a short-term view.
Disclaimer:
This publication has been carefully prepared only for general information and education purpose and is not a research report or any kind of investment advice. Neither authors of this publication nor Incwert Advisory Private Limited have any kind of conflict of interest with any company/firm/entity which has been cited and have been used for the sole purpose of illustration. It has been written in general terms and is not intended to address the circumstances of any particular individual or entity. Although we endeavour to provide accurate and timely information, there can be no guarantee that such information is accurate as of the date it is received or that it will continue to be accurate in the future. It should be seen as broad guidance only and does not constitute professional advice. You should not act upon the information contained in this publication without obtaining specific professional advice after a thorough examination of the particular situation. No representation or warranty (express or implied) is given as to the accuracy or completeness of the information contained in this proposal, and, to the extent permitted by law, Incwert Advisory Private Limited (“Incwert”), its members, employees and agents accept no liability, and disclaim all responsibility, for the consequences of you or anyone else acting, or refraining to act, in reliance on the information contained in this publication or for any decision based on it.

